General questions and answers
1. How do the Pflotsh apps help me?
Pflotsh Storm protects you from all kinds of severe-weather surprises and provides rainfall forecasts for the next 24 hours. With Pflotsh ECMWF, you get high-quality weather forecasts worldwide. Pflotsh SuperHD provides high-resolution weather forecasts in Central Europe.
2. Why are there several Pflotsh apps and not just one?
Each app is tailored to specific needs, has different functionalities, and above all includes a different selection of weather parameters and models. If everything were combined into a single app, it would be very confusing. With different apps, each one delivers exactly what you need for a specific purpose. See all Pflotsh apps at a glance.
3. Why are maps always at the center in the Pflotsh apps?
A weather map provides more information than weather data for a single location. For example: if you want to photograph a mountain, you don’t want to know whether there are clouds at the zenith, but whether the subject is disappearing into fog. And if you’re on the move, you want to know how the weather develops along your route.
4. When I move the map, the data disappears until I release it again. Why?
So you can see the map more clearly. The data is drawn with low transparency so that it isn’t disturbed by the map colors. This can sometimes make the underlying map hard to see. If you move it slightly, you’ll see it again.
5. How do I jump to the current time at my current location?
Shake your smartphone. Or choose the corresponding item from the menu.
6. How do I refresh the data for the location I’m currently viewing?
Press and hold the date display. Or choose the corresponding item from the menu.
7. Why do I only see a map?
Because there is no precipitation in the current map section. Tap the star and you can view storms from the past. Or select any point in the past. There’s also the unlikely possibility that a national weather service radar station is down.
9. What do the dots at the bottom mean?
The display is for time navigation. You can swipe in this display with your finger or tap a dot. This shows you the weather forecast for the selected time (see also Timeline in the Tips and Tricks). Alternatively, you can set a date by tapping the date display.
10. Why do I sometimes see more and sometimes fewer dots?
For one week, ECMWF computes forecasts at three-hour intervals; after that, one forecast every six hours.
11. Can I display something other than temperature on the map?
Tap a different title, for example wind gusts. You’ll see the green check mark next to it. The selected measurement is then shown on the map.
12. How do I switch between satellite and map view?
Go to the menu and tap Settings. You can then adjust the map type.
13. How do I select a time?
Tap the date display in the middle and choose a date and time. Confirm by tapping the check mark. You can also tap the arrows to the left (past) or right (future) (see also Timeline in Tips and Tricks).
14. How do I jump to the current time at my current location?
Shake your smartphone. Shaking also refreshes the data. Or choose the corresponding item from the menu.
20. How do I refresh the data for the location I’m currently viewing?
Press and hold the date display, or choose the corresponding item from the menu.
22. How can I see my position or something else on the map more clearly?
Swipe with two fingers on the time display at the very bottom to the left or right. This changes the transparency of the displayed data relative to the map (see Transparency in the Tips and Tricks).
17. Why is there no legend anywhere?
You don’t need a legend, because you can tap any point (see also Colors in the Tips and Tricks).
18. Why does it sometimes say “No data available”?
The app is showing an area for which no data is available—for example, countries that are not within the intended usage area of the app.
19. Why does Android sometimes show "vorm." or "nachm." in the date display?
Because your device is set that way. In your smartphone settings under System: Date and Time, activate the 24-hour format.
20. How are the apps paid for?
To cover the cost of data and ongoing development, the app charges an annual fee in the form of a subscription. The first month is free; i.e., if the subscription is canceled within the first month, no charge is made. Purchasing a Pflotsh ECMWF subscription also automatically unlocks all other Pflotsh apps on the same device.
21. And why aren’t the apps free?
This app and its data are extremely good. The app costs about as much per year as a single cappuccino on Zurich’s Bahnhofstrasse.
22. What can’t the apps do?
The apps do not replace warnings from the respective countries’ national weather services, but are a complement if you want to assess the situation yourself.
Pflotsh Storm
1. Why don’t I see temperature forecasts in Storm?
The app displays near-real-time radar data, storm tracking, and measurements from weather stations.
4. How accurate is the data?
The resolution of the radar data in Pflotsh Storm ranges from 250 m to 1 km depending on the region, lightning strikes are usually accurate within a radius of 100 metres. The rain forecast comes from a prediction model with a 3×3 km resolution, which is recalculated every three hours.
3. Where do the weather data come from?
For Storm, radar data comes from the respective national weather services, lightning data from various providers, and forecasts from Kachelmann GmbH and the German Weather Service (DWD).
4. Who creates the forecasts?
The radar forecasts and storm tracking are provided by Kachelmann GmbH, the model forecast is from the German Weather Service.
5. How precise are the forecasts?
In radar forecasting, radar echoes are shifted; new developments and weakening are not predicted. The forecast is updated every 5 minutes. Note for Austria: The current radar image is actually the 5-minute-old 5-minute radar forecast. The radar data provider Austrocontrol does not allow the display of the actual current radar image.
6. How far into the future do the forecasts extend?
The radar forecast via the weather model reaches 21 to 24 hours into the future.
7. How should the orange and red circles be interpreted, and what do the ladder- or antenna-like lines extending from them mean?
When a thunderstorm of a certain strength is detected, a circle appears around the storm cell. In addition, a line extending from the circle indicates the direction in which the storm is moving. You can therefore see from the line which way it is heading. Small cross marks along the line indicate the time of arrival in 10-minute steps. This construction of circle plus direction line takes different colours depending on storm intensity:
orange = moderate thunderstorm, red = strong thunderstorm, violet = extreme thunderstorm.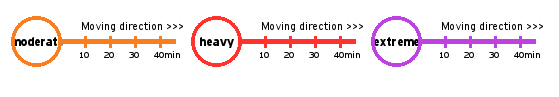 Tap the cloud icon of a detected storm cell to display extensive warning information: current position of the storm, hazards, details such as wind gusts and lightning rate, and places in the storm’s path. Please note that thunderstorm cells can change strength within just 5 minutes. Weakening, intensification, or a change of direction is always possible.
8. What do the small numbers in the circles mean?
These are measurements from weather stations. By default, the temperature for the selected time is shown. When you tap a station, all currently available measurement values from that station are displayed. In addition, the values are shown as curves over the past 24 hours.
9. Why are certain measurement values missing at some weather stations?
Not all weather stations can measure all values. Weather stations also deliver their data at different times and in different intervals.
10. What do the circles with arrows mean?
They show the direction and strength of the rotation of a storm cell. They appear only when a storm has rotation.

11. Why do I sometimes see a kind of carpet?
If there is a risk of flooding, the wave patterns indicate flood areas.

12. Can I see a precipitation forecast for any location?
Yes. Simply move the map. Precipitation forecasts are available for Germany, Switzerland, Austria, Luxembourg, Liechtenstein, and South Tyrol.
13. Why don’t I see any lightning?
Lightning from the past half hour is displayed.
14. Why is everything so pixelated?
That’s intentional! Each “pixel” represents one square kilometre, or in Germany an area of 250 × 250 metres. Each colour corresponds to a precipitation amount. Tap the pixels to see the rainfall value.
15. Why do I see hail even though there is no precipitation at that location?
The total amount of hail since midnight (UTC) is displayed, not the current hail amount.
Pflotsh SuperHD
1. What is the advantage of the SuperHD weather model?
The Swiss weather model “Central Europe Super HD” is created by the modelling experts at Kachelmann GmbH for Germany, Switzerland, Austria, and neighbouring regions. It has an exceptionally high resolution of 1×1 kilometres, which is unique among weather models. Weather models divide the calculation area into a grid, and in this case, the weather is calculated for each cell with a resolution of 1×1 kilometres. The major advantage is that geographical features, such as mountains, are represented very accurately, which allows the model to produce exceptionally good results.
2. What is the forecast range of SuperHD?
SuperHD provides forecasts for up to three days. In the forecast view, other models also cover a longer period.
3. How do I get a weather forecast?
To display the forecast for the current location, select “Forecast current location” in the menu or tap the forecast icon to the right of the date field see also Forecast in Tips and Tricks. To get a forecast for any location, move the map and press and hold the desired point.
4. Can I set an exact date for the forecast?
Tap the date display in the middle and select a date and time. Confirm by tapping the check mark. You can also tap the arrows to the left (past) or to the right (future).
5. What is the forecast range of SuperHD?
SuperHD provides forecasts for up to three days. In the forecast view, other models also cover a longer period.
6. Why are there several lines in the forecast that often show different weather?
In the overview, you see several weather models compared. This allows you to recognise uncertainties in the forecast. You can find more details by tapping the  button in the forecast view of the app.
7. What does “significant weather” mean?
SuperHD provides forecasts for up to three days. In the forecast view, other models also cover a longer period.
Pflotsh ECMWF
1. Why does this app cost so much?
The ECMWF model is licensed and very expensive. Considering that, the app is actually very inexpensive.
2. How does the subscription work?
A yearly subscription can be purchased for each Pflotsh app. If Pflotsh ECMWF is installed with a valid subscription, all other Pflotsh apps on the same device are automatically unlocked.
3. I have an ECMWF subscription, yet another Pflotsh app I expected to unlock still shows “no subscription”.
To allow users to try the apps, each app allows 20 operations (taps, calls, screen changes, etc.) before checking whether a subscription exists. So even if Pflotsh ECMWF is installed with a valid subscription, the app unlocked via ECMWF will continue to show “No subscription” until those 20 operations have been performed.
4. What is the ECMWF weather model?
The ECMWF is considered the best weather forecast model in the world and is the standard whenever important decisions are involved.
5. What is the resolution of the weather model?
The app uses the ECMWF at its highest resolution, approximately 9×9 km.
6. How do I choose which weather parameter is displayed?
Tap the title display at the top in the middle of the screen. Select the desired parameter (see also Selection under Tips and Tricks). It may take a moment for the data to load.
7. What does “significant weather” mean?
In the forecasts, significant weather refers to anything that may affect human safety. Most often this means precipitation or reduced visibility due to fog.
8. When I move the map, the data disappears until I release it. Why?
So the map can be seen more clearly. The data is drawn with low transparency so that it is not disturbed by the map colours. This sometimes makes the map underneath hard to see. If you move it slightly, it becomes visible again.
9. What do the grey circles mean, for example in “Temperature 2m”?
That is our display of the ensemble forecast. Even a small change in initial conditions can lead to large deviations in numerical forecast models. Therefore, the model is not only fed with measurements but also with slightly modified input data. This allows multiple model runs to be compared and extreme deviations identified. 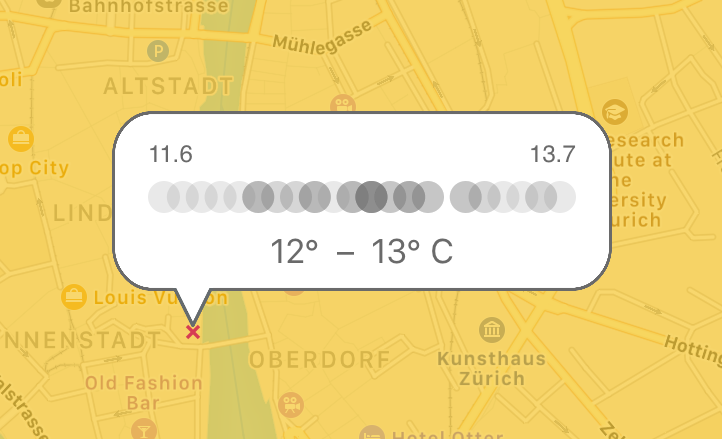 Each of the dots in the display corresponds to one such run. The two small numbers on the left and right represent the lowest and highest values in the ensemble. The values shown at the bottom represent the most likely forecast.
Pflotsh Tropical
1. What do I need Pflotsh Tropical for?
With Pflotsh Tropical, I am informed about all essential tropical weather phenomena. Worldwide.
2. Which weather model does Tropical use?
The ECMWF is considered the best weather forecast model in the world and is the standard whenever important decisions are involved.
3. What is the resolution of the weather model?
The app uses the ECMWF at its highest resolution, approximately 9×9 km.
4. How do I choose which weather parameter is displayed?
Tap the title display at the top in the middle of the screen. Select the desired parameter (see also Selection under Tips and Tricks). It may take a moment for the data to load.
5. Which weather parameters does Pflotsh Tropical show?
The probabilities for hurricane, tropical storm and tropical depression, as well as satellite images, satellite IR simulation, air pressure, wave height and water temperature.
Widgets
1. How do I add a Pflotsh widget on an iOS device?
Add it on your lock screen under “Edit”. (see Widgets for the iPhone in Tips and Tricks).
2. How do I add a Pflotsh widget on an Android device?
Depending on the smartphone manufacturer and Android version, the options for customising the home screen vary.
Apple Watch Allgemein
1. How are Pflotsh apps installed on the watch?
You need the “Watch” app on the iPhone. Under “My Watch”, the Pflotsh apps can be selected individually in the “Available Apps” section. After that, the Pflotsh apps are installed on the watch.
2. My current location is not shown on the Apple Watch, what can I do?
A force touch triggers a data reload (see also Apple Watch: Updating the location in Tips and Tricks).
3. How can I add the Pflotsh complication to a watch face?
In the “Watch” app on your iPhone, you can configure the watch faces. Or press and hold your watch face to enter the “Customize” mode. The individual elements of the face should now be outlined in green. Tap a complication and turn the crown until the desired Pflotsh complication appears.
4. I scroll through all complications, but Pflotsh does not appear.
Not all watch faces support complications. Complications have different sizes. Choose a complication with a suitable size to display the value from Pflotsh Storm. Small round complications work well.
5. The displayed location is incorrect. Why?
The app is not allowed to refresh the location in the background. Press firmly (force touch) on the display and select Reload.
Storm on the Apple Watch
1. How can I select a weather station for Storm on the Apple Watch?
Make sure the Pflotsh Storm app is active and visible in the foreground on your watch. Then, in the Pflotsh Storm app on the iPhone, tap any weather station. Ensure the app is visible on the Watch. Scroll down on the iPhone and select "Show on Watch". Note: “Show on Watch” only works while the Pflotsh Storm app is actively displayed in the foreground on your watch.
SuperHD on the Apple Watch
1. How can I change the location for the weather forecast in SuperHD?
On your iPhone, tap the desired location on the map. Then tap the heart icon and give the location a name. Make sure the Pflotsh SuperHD app is active and visible on your Watch. Then select “Show on Watch”. Note: “Show on Watch” only works while the Pflotsh SuperHD app is displayed in the foreground on your watch.
2. What do the lines on the left side of the Watch app mean?
They are an overview of several weather models for comparison. The same display exists in the app. This way, you can also see uncertainties in the forecast. You can find more details by tapping the in the forecast view of the app.
3. Why does the Watch app show a different time than the current one at startup?
The app only displays forecasts, not current measurements. The time shown at startup may be the forecast for the past or the coming hour, depending on which is closer to the present.
4. Why is there sometimes no weekday shown in the time display?
The weekday is only displayed when the forecast time is more than one day in the future.
5. Which weather models are shown in the Watch app?
The same models are used and displayed in the same order as in the iOS app. Initially, these are usually SuperHD, COSMO and ECMWF.
6. How can I change the location for the weather forecast on the watch?
On your iPhone, tap the desired location on the map. Then tap the heart icon and give the location a name. Make sure the Pflotsh SuperHD app is active and visible on your Watch. Then select “Show on Watch”. Note: “Show on Watch” only works while the Pflotsh SuperHD app is displayed in the foreground on your watch.